
Cole Baril
Wednesday, June 12, 2024 | 14 minutes
Mosquito Monitor: A Programmatic Approach to Enhancing Mosquito Surveillance Data
Mosquito Monitor

The City of Winnipeg conducts adult mosquito surveillance using New Jersey Light Traps from May to September, which is the active mosquito season in Winnipeg. Traps are collected on an irregular basis, but by and large on a daily basis on weekdays during peak periods (June-August). Trap counts are updated on the City of Winnipeg Website by the city. While the website displays data, there is no historical data available, and the map is dated and is difficult to interpret easily. Moreover, citizens are not notified of updates and must actively check the website to learn about changes to mosquito activity.
In this article, I will critique the presentation of City of Winnipeg mosquito trap count data and document the steps I took to improve upon their approach, augmenting the data with web applications, programmatic workflows, and a health alert notification system.
Trapping Methods
New Jersey Light Traps are a standard tool used in mosquito control operations due to their effectiveness and reliability. The City of Winnipeg operates 37 of these traps. New Jersey Light Traps are designed to capture mosquitoes by utilizing light as an attractant, typically employing ultraviolet light, which mosquitoes are naturally drawn to. Once the mosquitoes approach the light source, they are captured by the trap, which often contains an insecticide, killing the specimens. Thus, these traps are only useful for mosquito surveillance, and not for mosquito-borne virus surveillance, for which the CDC Light Trap is superior.

New Jersey Light Trap, manufactured by John W. Hock
The traps are permanent fixtures, strategically placed in locations where mosquito populations are known to be high or where monitoring is critical. This strategic placement helps in consistently gathering data on mosquito activity and density, which is crucial for effective control measures.
A key feature of New Jersey Light Traps is the incorporation of photoswitches with programmable timers. Photoswitches enable the traps to operate automatically based on the presence of light, turning on at dusk when mosquitoes are most active and off at dawn. The programmable timers allow for further customization of the trapping schedule, ensuring that the traps operate during peak mosquito activity periods, which maximizes the number of mosquitoes captured.
The data collected from these traps is invaluable for mosquito control programs. It helps in identifying trends in mosquito populations, determining the effectiveness of control measures, and assessing the risk of mosquito-borne diseases. By analyzing this data, mosquito control professionals can make informed decisions on where and when to implement additional control measures, such as larviciding or adulticiding, to reduce mosquito populations and minimize the risk of disease transmission.
Overall, New Jersey Light Traps are a crucial component of integrated mosquito management strategies, providing reliable, long-term monitoring and control of mosquito populations.
Data from the City
The presentation of mosquito trap counts for the city of Winnipeg has several issues that make it challenging to interpret and utilize effectively. Firstly, there is no access to historical data, which prevents any analysis of trends or comparison with previous data to understand changes in mosquito populations over time. This lack of context limits the ability to assess the effectiveness of mosquito control measures. Additionally, the absence of color coding makes it difficult to quickly identify areas with high or low mosquito counts. Implementing a gradient or color-coded system would enhance visual interpretation and allow for immediate recognition of problem areas.

City of Winnipeg Data Example, viewable here
Moreover, the overall layout is cluttered and overwhelming. The combination of a detailed map and multiple data tables makes it challenging to analyze the information at a glance. The presentation lacks visual distinctions or significant markers to highlight the highest or lowest counts, making it less intuitive. This complexity could be mitigated by simplifying the layout, using separate sections for each quadrant, and including a clear legend.
Additionally, there are no notifications when the data is updated. Citizens need to visit the site in order to view updates, and the site is updated at varying points throughout the day on different days.
Lastly, the presentation lacks graphical elements such as bar charts or line graphs, which could help visualize daily averages or trends over time, making the data more accessible and easier to analyze.
Thus, my goal was to improve upon the existing data by creating a better way to visualize the data by using colour coding, store historical data so that data for previous days can be observed and compared, include additional plots such as jitter plots comparing the current year to previous years, include summary datatables, and include weather data mapped against trap counts. Moreover, I sought to improve accessibility of the data by implenting a “health alert” notification system such that citizens can be notified when an update to the data occurs.
Step 1: Obtain City Data
To start, I needed to obtain the data as it was updated. To accomplish this, I used the rvest R package to read the elements of the City of Winnipeg website and extract the data, namely the trap counts for each trap and the date the website was last updated. This is accomplished in relatively few lines of code:
# Define the URL you want to scrape
url <- "https://legacy.winnipeg.ca/publicworks/insectcontrol/mosquitoes/trapcounts.stm"

# Check date updated

webpage <- read_html(url)

date_updated <- html_nodes(webpage, "#lastUpdateDate") %>%
  html_text() %>%
  str_extract(., "\\b[A-Za-z]+ \\d{1,2}, \\d{4}\\b")

date_updated <- format(as.Date(date_updated, "%B %d, %Y"), "%Y-%m-%d")

# Function to scrape and save data
scrape_and_save_data <- function() {
  # Scrape data from the website
  webpage <- read_html(url)

  data <- webpage %>%
    html_table(fill = TRUE) %>%
    .[[2]]  # Assuming the data is in the first table

  return(data)
}
There is a check in the script to identify if the data needs to be updated. Essentially, if the latest date in the data is equal to today’s date OR the date updated is not equal to the current date, the script to obtain the data will not run. This assumes that the data will only be updated at a maximum of once per day.
if(max(master_data_old$date) == Sys.Date() | date_updated != Sys.Date()) {

  message(paste0("Data is already up to date as of ", Sys.Date(), "."))

  message(paste0("Website last updated: ", date_updated, "."))

}
After the data is obtained, there are a number of cleaning steps carried out using primarily tidyverse packages. The data is then saved as a .csv file to the Mosquito Monitor Github Repository.
?raw=TRUE to the link to download raw data or read it as a .csv using code. While this data was obtained from the City of Winnipeg, please cite this repository using the citation provided in the README.Scheduling
One problem that presented itself is that the time and day when the data is updated on the City of Winnipeg website is not consistent. Thus, to ensure the data is always up-to-date, I used a GitHub Actions Workflow to run the script to check if the data needs to be updated once per hour as a Cron job. If the data needs to be updated, the rest of the script will run and save the data.
Notably:
name: Scrape Data
on:
  schedule:
    - cron: '0 * * * *' # This will run the workflow at the beginning of every hour

jobs:
  import-data:
    runs-on: ubuntu-latest
    steps:
      - name: Set up R
        uses: r-lib/actions/setup-r@v2

      - name: Install packages
        uses: r-lib/actions/setup-r-dependencies@v2
        with:
          packages: |
            any::tidyverse
            any::janitor
            any::rvest

      - name: Check out repository
        uses: actions/checkout@v3
        with:
          token: ${{ secrets.SCRAPE_DATA_SECRET }}


      - name: Import data
        run: Rscript -e 'source("scrape_mosquito_data.R")'

      - name: Commit results
        run: |
          git config --local user.email "actions@github.com"
          git config --local user.name "GitHub Actions"
          git add mosquito_data.csv
          git commit -m 'Data updated' || echo "No changes to commit"
          git push origin || echo "No changes to commit"
Step 2: Data Visualization
Shiny App
I made use of Shiny to build an app to display City of Winnipeg mosquito trap count data. The app can be viewed here and is embedded below.
The app reads data directly from the Mosquito Monitor GitHub repository, so it always has access to the most up to date data.
The app displays:
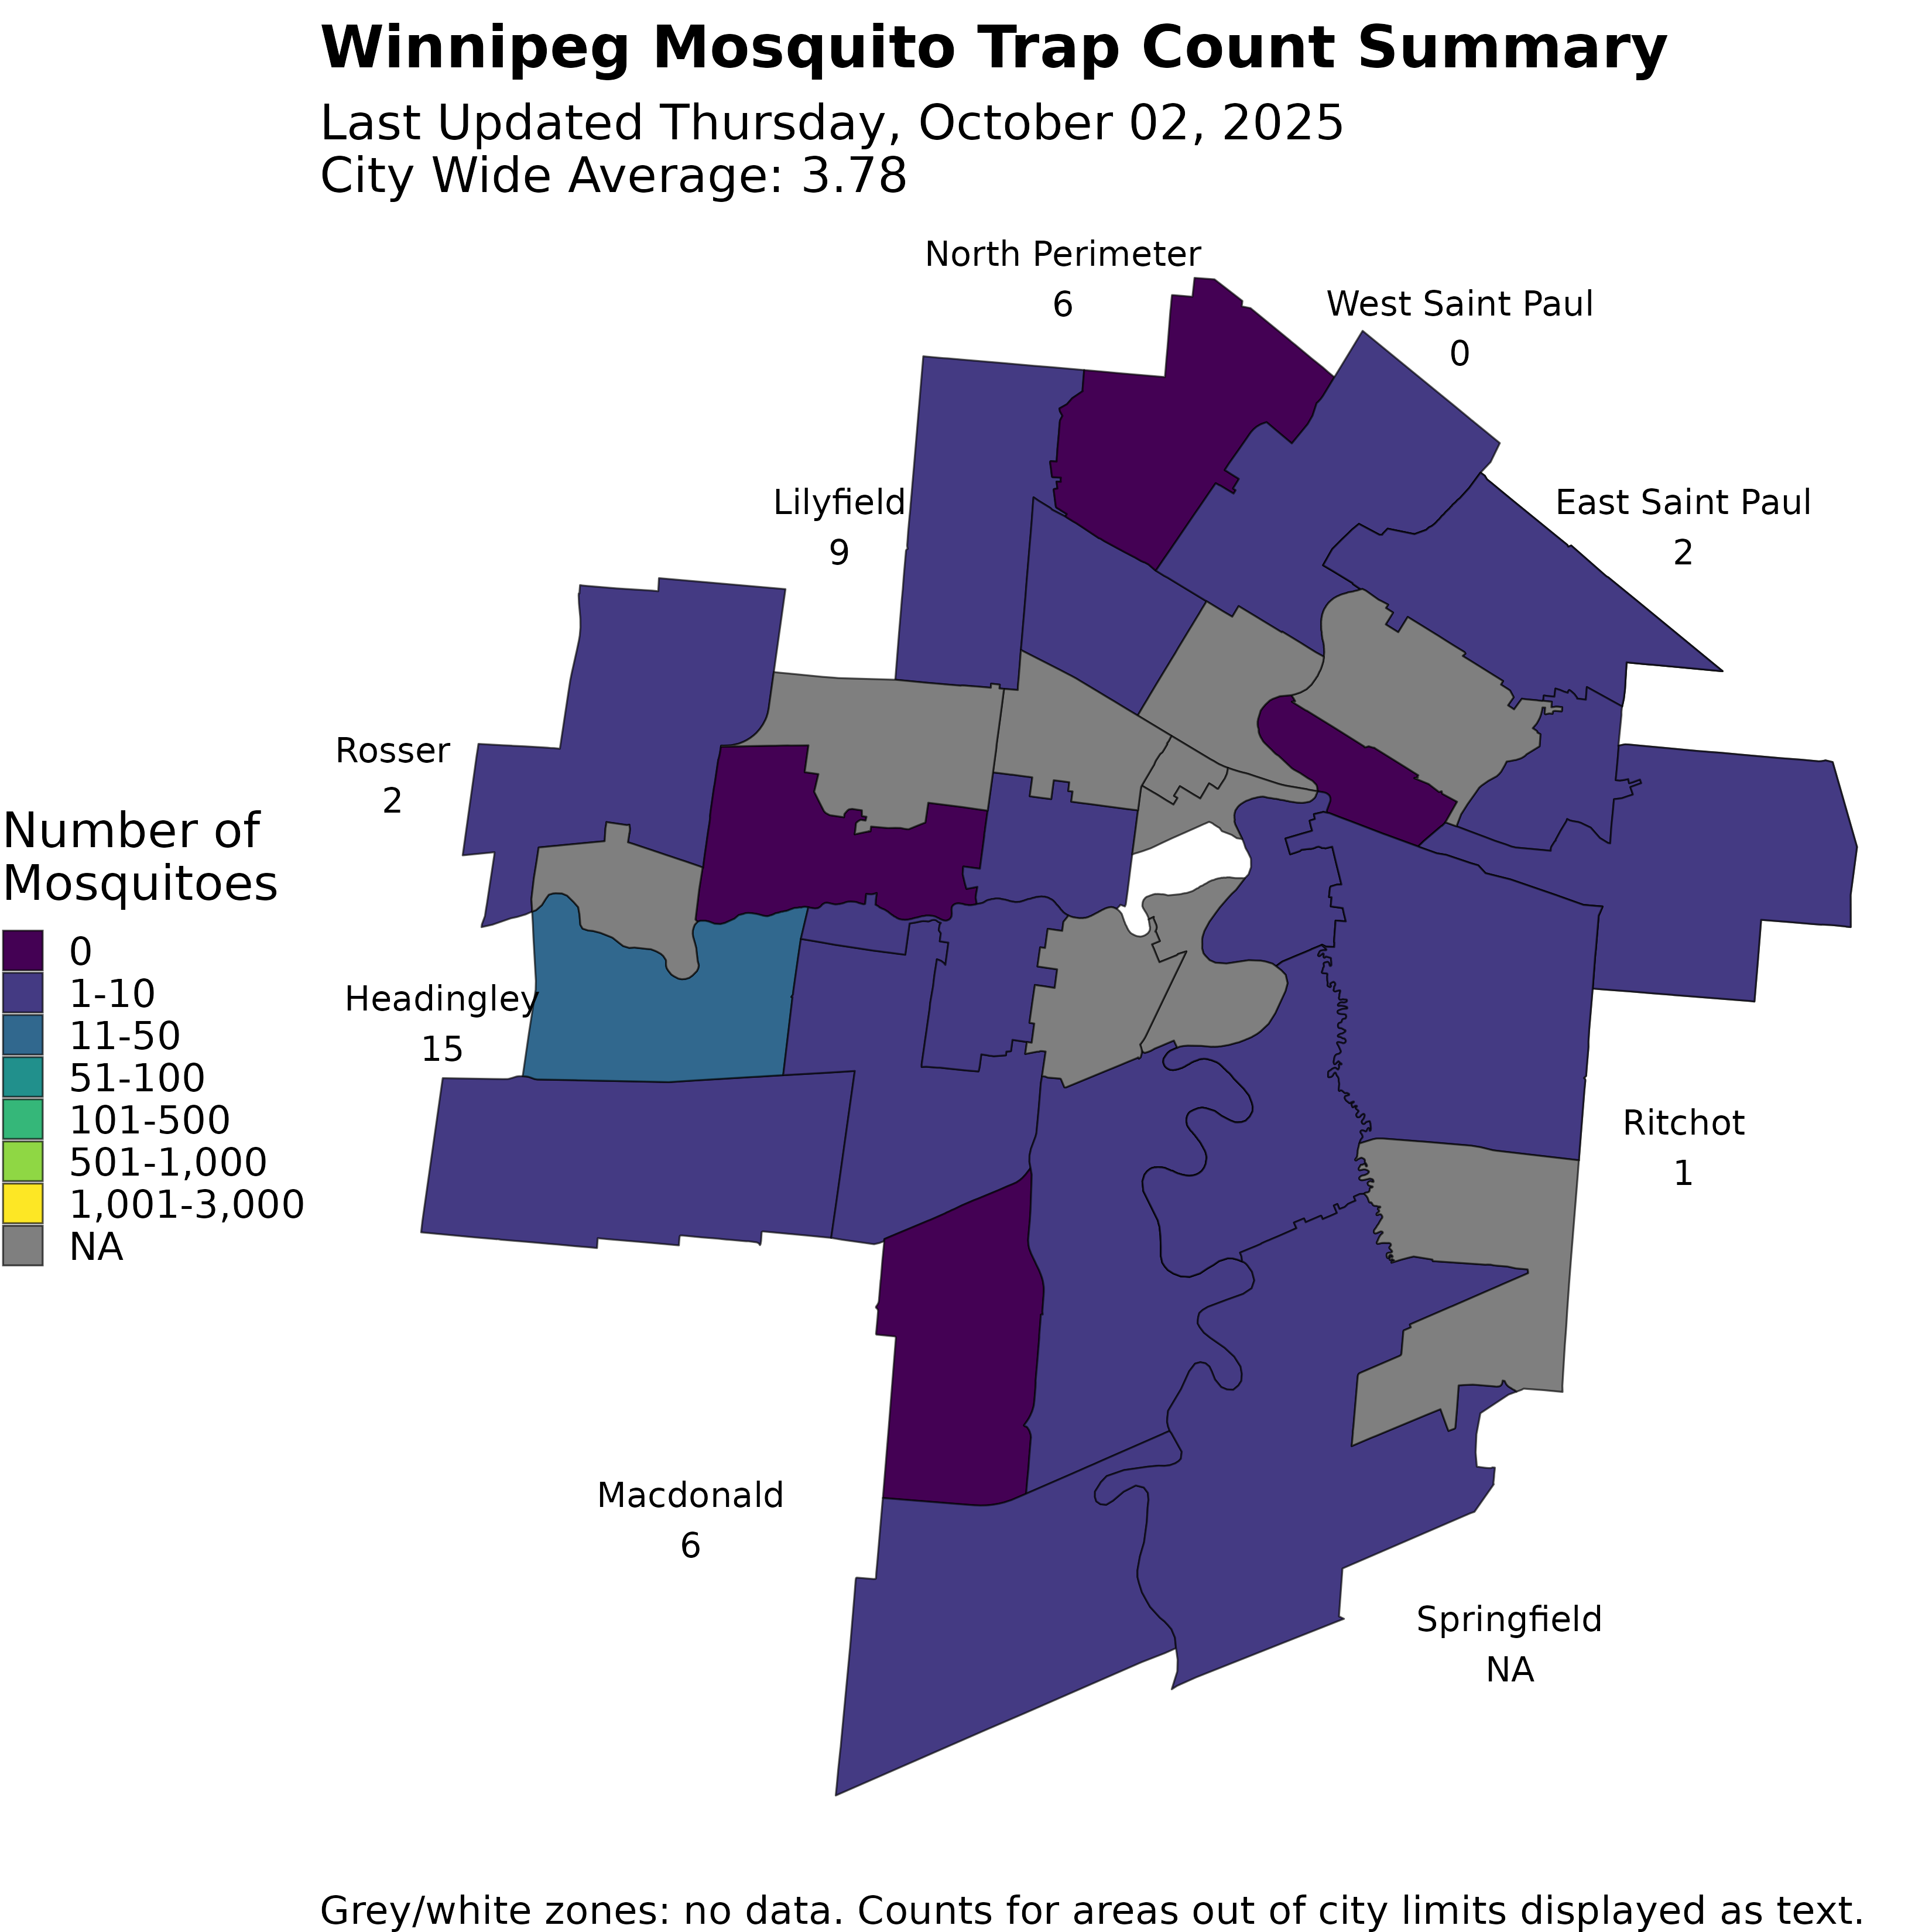
- Map of City of Winnipeg with an absolute colour legend displaying the number of specimens trapped in each Forward Sortation Area (FSA). For traps outside of city limits, the trap counts are displayed as text. The date you wish to view can be selected; dates with data are marked by a dot in the selection calendar.
- Jitter plots displaying the number of mosquitoes trapped each week for the current year (red) and previous years (grey). The date range you wish to view can be selected, as well as the dataset (City of Winnipeg or City of Winnipeg Metro region). Moreover, the historical data years can be toggled.
- Datatables showing a summary of each region as well as raw data.
- Historical data
- Historical weather data
Example of a jitter plot showing current data (red) plotted against historical data (grey) for many weeks:

Example of City of Winnipeg historical data (2015-2023):

App:
Winnipeg Map
In addition to the Shiny app, a separate Winnipeg map figure is generated, coloured by FSA, as shown below. This figure is saved in the GitHub repository after the data is updated and is used by the script that posts the mosquito trap count update to Twitter / X.
A GitHub Actions workflow is programmed to only run the script to update the figure below when the data (mosquito_data.csv) is updated.
on:
  push:
    branches:
      - main
    paths:
      - mosquito_data.csv
 - name: Check out repository
        uses: actions/checkout@v3
        with:
          token: ${{ secrets.SCRAPE_DATA_SECRET }}
The resulting image is then saved to the GitHub repository and can be accessed by external sources.
Step 3: Health Alert
When the image above is updated in the GitHub repository, another GitHub workflow runs that triggers a tweet to be sent from the Mosquito Monitor Twitter/X account, @MosquitoMonitor. Tweets will only be sent when the image is updated, which at most is once per day. Below is an example of such a Tweet.
City of Winnipeg mosquito trap counts have been updated as of 2024-06-13. See a detailed update here: https://t.co/seKxaKh9Zr. #Winnipeg #Mosquitoes #Mosquito #CityOfWinnipeg #HealthAlert pic.twitter.com/ouMo4rr7Nf
— Mosquito Monitor (@MosquitoMonitor) June 13, 2024
Tweepy
I used the Tweepy Python library to send the Tweet. Then script below is triggered when the image above is updated (i.e., when the data gets updated). My Twitter API keys have been cloaked as secrets in GitHub and are called from the environment in the script. Both versions of the Twitter APIs (API 1.1 and API 2.0) were used. API Version 2.0 is required to actually send the tweet, while API Version 1.1 is required to append media to the tweet.
import tweepy
import os
import requests
from datetime import datetime


consumer_key = os.getenv('CONSUMER_TOKEN')
consumer_secret = os.getenv('CONSUMER_TOKEN_SECRET')
access_token = os.getenv('ACCESS_TOKEN')
access_token_secret = os.getenv('ACCESS_TOKEN_SECRET')

def get_twitter_conn_v1(consumer_key, consumer_secret, access_token, access_token_secret) -> tweepy.API:
    """Get twitter conn 1.1"""

    auth = tweepy.OAuth1UserHandler(consumer_key, consumer_secret)
    auth.set_access_token(
        access_token,
        access_token_secret,
    )
    return tweepy.API(auth)

def get_twitter_conn_v2(consumer_key, consumer_secret, access_token, access_token_secret) -> tweepy.Client:
    """Get twitter conn 2.0"""

    client = tweepy.Client(
        consumer_key=consumer_key,
        consumer_secret=consumer_secret,
        access_token=access_token,
        access_token_secret=access_token_secret,
    )

    return client

client_v1 = get_twitter_conn_v1(consumer_key, consumer_secret, access_token, access_token_secret)
client_v2 = get_twitter_conn_v2(consumer_key, consumer_secret, access_token, access_token_secret)

if not all([consumer_key, consumer_secret, access_token, access_token_secret]):
    raise ValueError("Twitter API credentials are not set properly")

# URL of the image
image_url = 'https://raw.githubusercontent.com/colebaril/Mosquito_Monitor/main/wpg_mosquito_map_tmp.png'
local_image_path = 'wpg_mosquito_map_tmp.png'

# Download the image
response = requests.get(image_url)
if response.status_code == 200:
    with open(local_image_path, 'wb') as file:
        file.write(response.content)
    print(f"Image downloaded and saved to {local_image_path}")
else:
    print(f"Failed to download image. Status code: {response.status_code}")

media_path = local_image_path
media = client_v1.media_upload(filename=media_path)
media_id = media.media_id

# Get the current date
current_date = datetime.now().strftime('%Y-%m-%d')

# Create a tweet
message = f"City of Winnipeg mosquito trap counts have been updated as of {current_date}. See a detailed update here: https://shorturl.at/LkDqU. \n#Winnipeg #Mosquitoes #Mosquito #CityOfWinnipeg #HealthAlert"
client_v2.create_tweet(media_ids=[media_id], text=message)
print("Tweeted!")
Technology Stack
R
R is a powerful programming language and software environment used for statistical computing and graphics. In this project, R plays a crucial role in data scraping, cleaning, and visualization. The rvest package is specifically used to scrape the mosquito trap count data from the City of Winnipeg’s website. Additionally, R’s tidyverse packages are employed for data manipulation and transformation, ensuring the data is clean and ready for analysis.
Python
Python is another versatile programming language used in this project, particularly for its robust libraries and tools for automation and integration. The Tweepy library is used to interact with the Twitter API, allowing for automated tweeting of mosquito activity updates. Python’s straightforward syntax and extensive libraries make it ideal for handling the automation of notifications and integrating various components of the project.
Shiny
Shiny is an R package that makes it easy to build interactive web applications directly from R. In this project, Shiny is used to create an interactive dashboard that displays mosquito trap count data. The Shiny app allows users to explore the data through maps, jitter plots, and datatables, making the data more accessible and engaging for the public. It ensures that users can visualize and interact with the data in real-time.
GitHub Actions
GitHub Actions is a powerful automation tool that enables continuous integration and continuous deployment (CI/CD). In this project, GitHub Actions is used to automate the process of data scraping and updating the data repository. By setting up a workflow that runs every hour, the project ensures that the mosquito data is always up-to-date. GitHub Actions also automates the generation of updated maps and the posting of updates to Twitter, streamlining the entire process.
Closing
In summary, the Mosquito Monitor project addresses the shortcomings of the City of Winnipeg’s mosquito surveillance data presentation by developing programmatic tools to improve data accessibility and visualization. The project involves scraping and cleaning data from the city’s website, implementing a Shiny app for interactive visualization, and setting up an alert system to notify citizens of updates. By using New Jersey Light Traps, the city collects valuable mosquito population data, which is then enhanced with color-coded maps, historical data, weather comparisons, and graphical representations to better inform and protect the public.
Overall, Mosquito Monitor offers a significant improvement in mosquito surveillance, enabling better access to information and timely public health alerts. This project exemplifies how data science and technology can enhance public health initiatives and foster a more informed community.
References
Baril, C., Pilling, B.G., Mikkelsen, M.J. et al. The influence of weather on the population dynamics of common mosquito vector species in the Canadian Prairies. Parasites Vectors 16, 153 (2023). https://doi.org/10.1186/s13071-023-05760-x.
City of Winnipeg (2024). Nuisance Mosquito Trap Counts. https://legacy.winnipeg.ca/publicworks/insectcontrol/mosquitoes/trapcounts.stm.
City of Brandon (2024). Mosquito Abatement Program. https://brandon.ca/mosquito-abatement/mosquito-abatement-program.
Environment and Climate Change Canada (2024). WINNIPEG A CS Weather Station. https://climate.weather.gc.ca/climate_data/.
R Core Team (2023). R: A Language and Environment for Statistical Computing. R Foundation for Statistical Computing, Vienna, Austria. https://www.R-project.org/.
Python Software Foundation. (2024). Python Language Reference, version 3.10. Available at https://www.python.org.
Wickham H, Averick M, Bryan J, Chang W, McGowan LD, François R, Grolemund G, Hayes A, Henry L, Hester J, Kuhn M, Pedersen TL, Miller E, Bache SM, Müller K, Ooms J, Robinson D, Seidel DP, Spinu V, Takahashi K, Vaughan D, Wilke C, Woo K, Yutani H (2019). “Welcome to the tidyverse.” Journal of Open Source Software, 4(43), 1686. doi:10.21105/joss.01686 https://doi.org/10.21105/joss.01686.
Wickham H (2024). rvest: Easily Harvest (Scrape) Web Pages. R package version 1.0.4, https://CRAN.R-project.org/package=rvest.
Chang W, Cheng J, Allaire J, Sievert C, Schloerke B, Xie Y, Allen J, McPherson J, Dipert A, Borges B (2023). shiny: Web Application Framework for R. R package version 1.8.0, https://CRAN.R-project.org/package=shiny.
Pebesma E, Bivand R (2023). Spatial Data Science: With applications in R. Chapman and Hall/CRC. doi:10.1201/9780429459016 https://doi.org/10.1201/9780429459016, https://r-spatial.org/book/.
LaZerte S, Albers S (2018). “weathercan: Download and format weather data from Environment and Climate Change Canada.” The Journal of Open Source Software, 3(22), 571. https://joss.theoj.org/papers/10.21105/joss.00571.
Firke S (2023). janitor: Simple Tools for Examining and Cleaning Dirty Data. R package version 2.2.0, https://CRAN.R-project.org/package=janitor.
Grolemund G, Wickham H (2011). “Dates and Times Made Easy with lubridate.” Journal of Statistical Software, 40(3), 1-25. https://www.jstatsoft.org/v40/i03/.
Xie Y, Cheng J, Tan X (2023). DT: A Wrapper of the JavaScript Library ‘DataTables’. R package version 0.31, https://CRAN.R-project.org/package=DT.
Chang W (2021). shinythemes: Themes for Shiny. R package version 1.2.0, https://CRAN.R-project.org/package=shinythemes.
Roesslein, Joshua. (2024). Tweepy: Twitter for Python! Available at https://www.tweepy.org.
Reitz, Kenneth, & Chisom, Cory. (2024). Requests: HTTP for Humans [Software]. Available at https://docs.python-requests.org/en/latest/.